Virginia, USA

Discover 5 metrics that can NOT be missing in your Facebook Reports

Between ups and downs, believe it or not Facebook is still the most used network.

With 3.03 billion monthly active users worldwide, Facebook leads the 2023 ranking as the most popular Social Network.

Por esto queremos traerte las métricas más importantes que debes medir en Facebook para saber que tal es el rendimiento de tu marca y tus estrategias en esta plataforma.

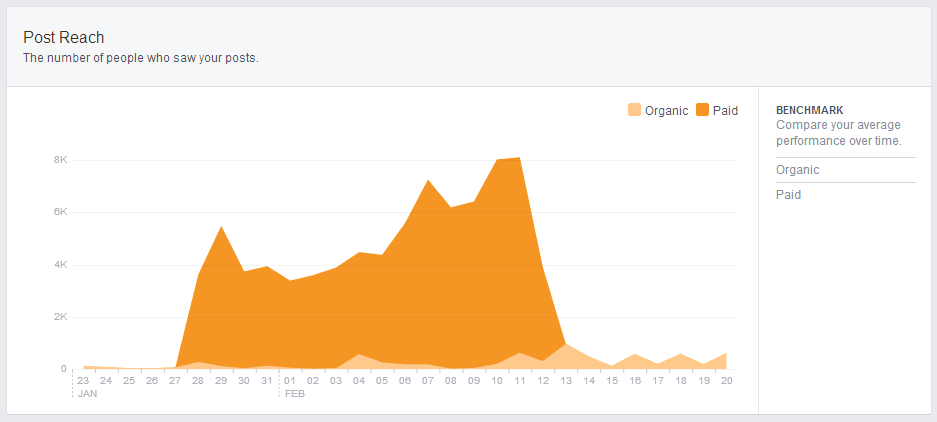
Reporting can be a headache, especially if you don't know what data to include. I share with you 5 metrics that can not miss in your reports for Facebook, click and find out what they are.

Contenido

What are metrics?

Before we dive into metrics, let me first give you a brief definition of what metrics are. Metrics are data that allow you to identify progress and measure the success of your marketing strategies. They represent the starting point to identify improvements, areas of correction and growth in your strategies. These are the 5 metrics you should measure on Facebook:

1. Reach:

Represents the number of unique users who have seen your publication. These reaches can be organic or paid. Organic reach is the number of unique users who naturally see your content either in their news feed or by visiting your Facebook page. Paid reach is the number of users that have seen a publication paid by your page, that is to say that you paid for people to see that publication.

2. Impressions:

They are the number of times your content has been shown.

What is the difference between reach and impressions?

I know that at the beginning it can be difficult to differentiate a reach from an impression, so let me explain the difference between these two metrics with an example. Suppose John unlocks his cell phone and opens the Facebook app. When he opens his app, he sees your post “X” for the first time. At this point Facebook will count 1 reach and 1 impression. Two hours later, John opens his Facebook app again and while viewing the news feed or home, he sees your post again. This time, Facebook will count 2 impressions but will no longer count it as a reach.  On the other hand Ana, opens her Facebook app and sees your post “X”. So the total results would be 2 reaches (John and Ann) and 3 impressions (John saw the post twice while Ann saw it once). Do you see it? The Scopes count numbers of unique users who view a given publication, therefore a unique user can only be counted once, while Impressions account for the number of times that your content has been displayed regardless of whether it was to the same person. I hope the example has helped you, having clarified these differences, let’s continue with the metrics.

3. Engagement:

Esta métrica se encarga de medir la relevancia de tu post para el público. Dentro de las métricas de interacción encontramos:
  • Reacciones: (Los me gusta, me encanta, me divierte, me asombra, me entristece y me enoja). Estas muestran la validación y aceptación o la negativa de los usuarios hacia tu post. Medir estos números nos permite estar atentos a los gustos y necesidades de nuestro target. Sabiendo esto puedes permitirte variar de contenidos para ver los sentimientos que generas en la audiencia y tomar decisiones al respecto.
  • Comentarios: Estos muestran un nivel de implicación alto de los usuarios con tu post.
  • Compartidos: Develan el grado de viralidad de un post.
  • Me gusta de la página y seguidores

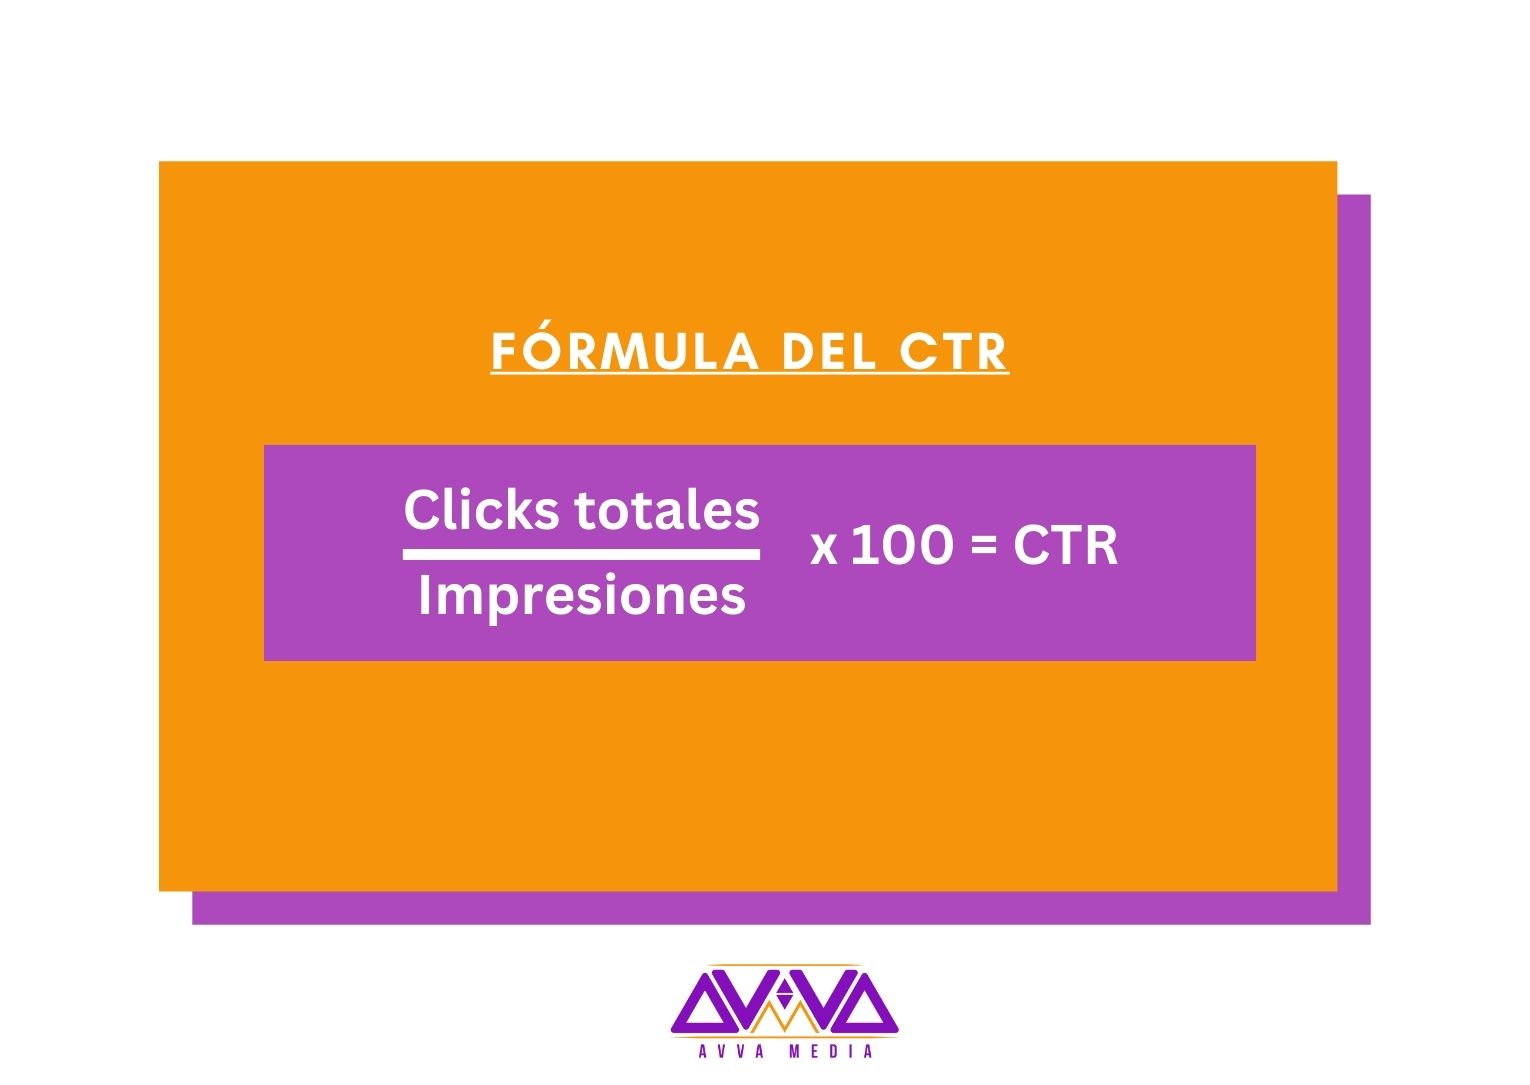
4. CTR (Click Through Rate):

Esta métrica calcula la Tasa de Clicks para determinar el porcentaje de personas que ven un Anuncio y hacen Click en él. Esto nos permite ver que tan efectivos son nuestros CTA en las publicaciones y si realmente estos están funcionando o no. Un CTR bajo significa que las personas ven tus publicaciones pero no se sienten atraídas a clickar en la mismo. Cuando el CRT de una publicación es bajo, el Algoritmo de Facebook podría elegir no mostrar tu contenido a la audiencia ya que el CTR les está indicando que el contenido de esa publicación no es relevante. Te dejamos la fórmula para calcular esta métrica en el siguiente cuadro:

5. Tasa de finalización promedio:

No es un secreto que el formato de video es el contenido estrella en las plataformas sociales, por lo que, si no estás haciendo contenido de video ¡te recomendamos hacerlo cuanto antes!

Si bien cuenta que un usuario vea tu video, lo importante es qué porcentaje de esas personas llegaron hasta el final del mismo.

Facebook usa esta métrica para determinar qué capacidad tiene tu video de atraer la atención de los usuarios, por lo que si esta métrica es baja, no mostrará el video.

Si esto te pasa sería bueno que te plantees optimizar el contenido de tus videos y su tiempo de duración ya que el formato de videos cortos es lo que ha marcado tendencia estos últimos años, aunque ¿te cuento un secreto? Entre las tendencias que se estiman para este 2024 ¡se espera el retorno de los videos largos!

Dejame en los comentarios si quieres que escriba un artículo sobre esto o sobre cualquier otra temática relacionada al Marketing Digital.

Esperamos que este contenido te sea de ayuda, si tienes dudas, o necesitas alguna consultoría de Marketing Digital puedes comunicarte a mi correo l.figueroa@avvamedia.com

Leave a Reply

Your email address will not be published. Required fields are marked *

Comparte este artículo:

Artículos Relacionados